






ShfrahData solutions
For CEOs, CFOs and operations managers
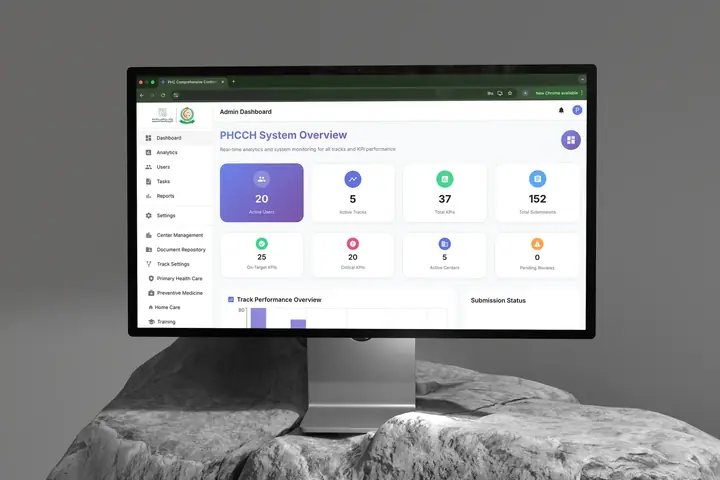
Power BI Dashboards & Data Analytics
We bring ERP, accounting, point of sale and Excel into one view you can trust.

Your data sits across ERP, accounting, point of sale, CRM and Excel files. We connect it in one data model and build Power BI dashboards in Arabic that show numbers whose definitions you have agreed, refresh by themselves and alert the right person when a figure drifts.
Fluent in data
- Power BI dashboardsPower BI
- Data model
- Data warehouseDWH
- Scheduled refresh
- Access by branch or roleRLS
- Performance indicatorsKPI
From scattered sources to one number everyone trusts
We start by assessing your data, then build the layer that joins it, then the dashboards your team reads every morning.
-
Connecting the sources
ERP, accounting, point of sale, CRM, Excel and Google Sheets, databases and APIs.
-
A data model and a warehouse
We unify customers, products and branches, and build a warehouse or data mart with scheduled refresh.
-
Dashboards and reports that read well in Arabic
Right-to-left layout, a phone view and detail that opens from the number itself.
-
KPIs with agreed definitions
We write down with your team what each KPI means and how it is calculated, so finance and sales stop quoting different numbers.
-
Access by branch or role
Each manager sees only their branch or region, and data stays in the Kingdom or in your own cloud tenant where required.
-
Alerts that reach the right person
When a branch falls under target or a source refresh is late, the alert goes to the person responsible.
From source to decision in one path
Each step hands the next clean data with a clear definition, with no hand copying between files.
-
01
Sources
ERP · Accounting · POS · CRM
-
02
Connect and clean
Excel · Databases · APIs
Scheduled refresh -
03
Model and warehouse
KPI definitions · Relationships
Fabric or Azure where it fits -
04
Dashboards and reports
Arabic · Phone · Access
Power BI -
05
Alerts and handover
Alerts · Training your team
Handover to your team
The same data, shaped for each reader
Pick your role to see what changes in your day.
Month-end without chasing files
- Sales, costs and margin straight from the accounting source
- Branches and periods compared on one definition per number
- Detail that opens from the number down to the entry

A clear model your team keeps
- Documented sources and models, with scheduled refresh you watch from one place
- Training and handover, so your team extends the dashboards after us
- New reports on the same model with no rebuild

A meeting that starts from the numbers, not an argument about them
- One dashboard for the company, and a phone view for those on the move
- An alert reaches the area manager before the meeting, not after
- Sales and demand forecasts where your data supports them


Free consultation
Tell us about your data
Fill in the form and we'll get back to you within 1–2 business days.
What happens next
- 01UnderstandWe learn your problem and your business before any code.
- 02BuildReal engineering with tests, reviews and incremental delivery.
- 03Launch & supportWe launch, measure, and stay with you after handoff.
Part of the Hawih family since 2007Saudi team in Riyadh
Organisations that have trusted the Hawih group








Frequently asked
We pick what fits. Power BI is faster and more flexible for most companies; a custom dashboard fits better when it is embedded in your system or seen by your customers. We start with an assessment of your data before deciding.
ERP, accounting, point of sale, CRM, Excel and Google Sheets files, databases and APIs. How each connection works depends on what the system itself allows, and we tell you after the assessment.
We work to what your organisation requires: inside the Kingdom or in your own cloud tenant. The data is yours and under your control, and access rules decide who sees which branch or figure.
We sit with finance, sales and operations and write down each KPI's definition, calculation and source, then agree it with you before building the dashboard, so one number never contradicts another.
Yes. We train your team and hand over the model and documentation, and they add new reports on the same model. We stay on for support if you want.
Usually 2 to 4 weeks for a first working dashboard, depending on the state of your data and the number of sources. We set a clear schedule after the assessment.
Free consultation
Let's turn your numbers into one view
A free consultation to understand your data sources. We reply within 1–2 business days.